Release Date: July 28, 2026
Product Area: Reports & Analytics
We are excited to introduce an enhanced reporting experience designed to provide greater visibility into your operational data and make it easier to access, analyze, and share insights across your organization.
What’s New?
The updated Reports experience consolidates reporting capabilities into a more intuitive interface, allowing users to navigate between available reports, interact with data visualizations, and access detailed information more efficiently.
Note: This feature must be enabled by the Kiuey team. Contact Kiuey Support for more information.
Key Benefits
Access reports more efficiently
Users can now access available reports from a centralized location, making it easier to find and navigate between different reporting views.
Gain deeper insights through interactive data
Reports now provide improved visualization capabilities, allowing users to apply filters, interact with charts, and analyze information based on their specific needs.
Review detailed information behind the data
Users can explore both summarized visualizations and detailed records to better understand trends, identify issues, and support decision-making.
Export data for additional analysis
Users can export report data into CSV files, allowing teams to perform additional analysis, share information, and integrate insights into their existing workflows.
Before:
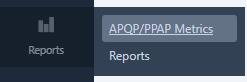
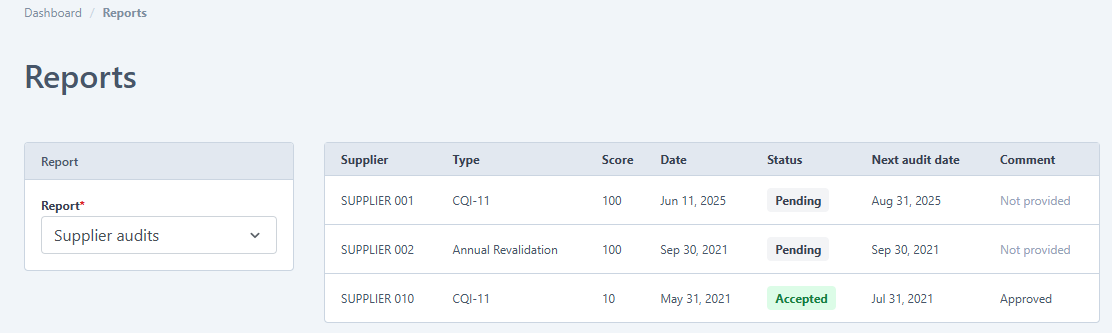
After:
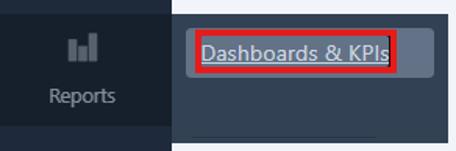
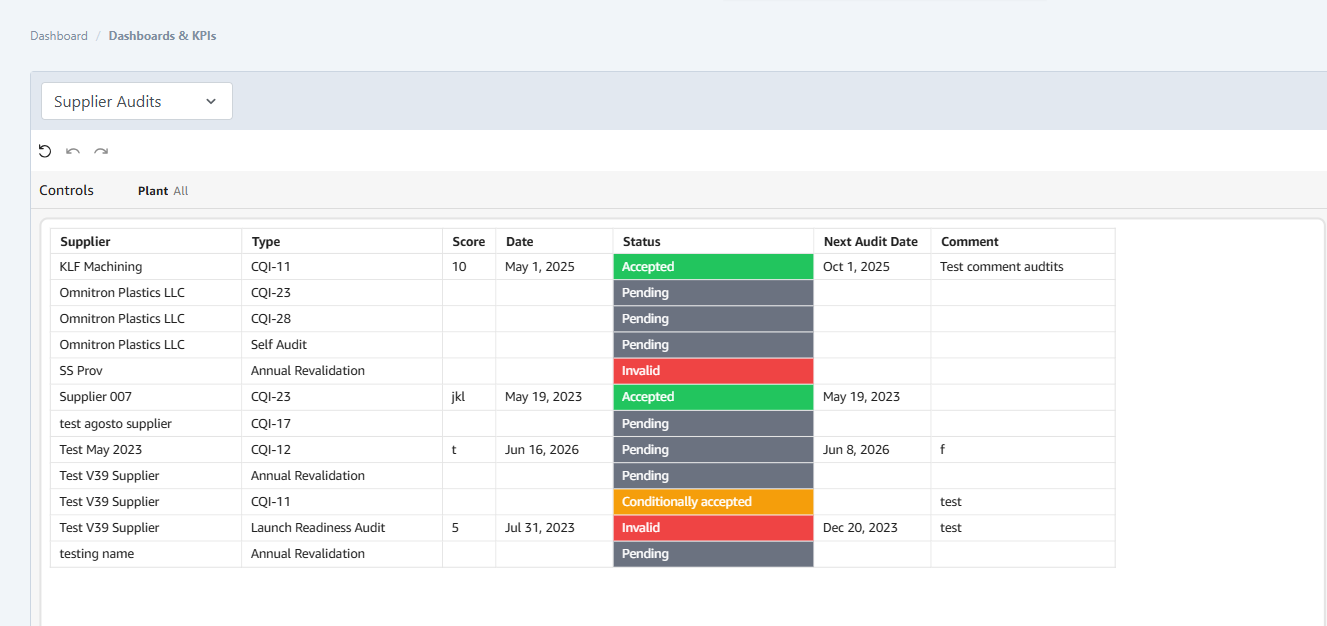
Report Tabs
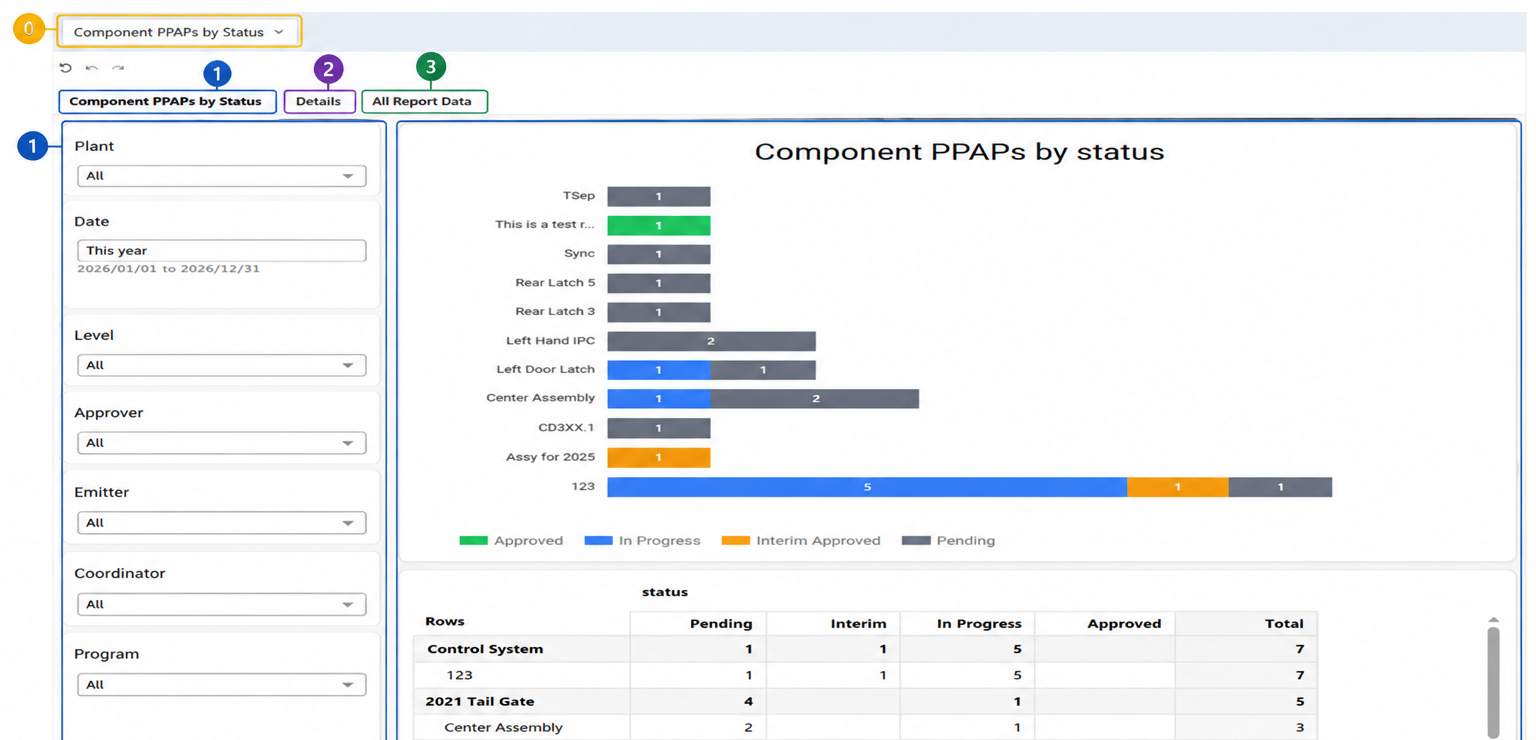
0) Report Selector: Select and switch between available reports from a centralized location
1) Interactive Graphics: Review visual representations of your data, apply filters, and adjust report parameters.
2) Chart Data (Details): Explore the records represented within each visualization.
3) Full Data (All Report Data): Access the complete dataset associated with the selected report. This can be useful when reviewing complete report details beyond what is shown in the chart.
Exporting Data
Each report includes an Export to CSV option.
This allows users to download report data for additional analysis or sharing.

What You Need to Do
No action is required from your team. The updated reporting experience is available once enabled for your account.
We encourage you to explore the enhanced Reports experience and reach out to your Customer Success Manager if you have any questions or would like to review the new capabilities.
Was this article helpful?
That’s Great!
Thank you for your feedback
Sorry! We couldn't be helpful
Thank you for your feedback
Feedback sent
We appreciate your effort and will try to fix the article